
For every employee who files a support ticket, there are several more in the background quietly losing productivity when their laptop freezes or the app doesn’t load.
IT leaders typically miss these issues, but they’re a drain on employee morale and output. Even when they want to fix them, knowing how to measure digital employee experience properly is harder than it looks.
Several issues might get in the way, including:
- Not knowing which metrics actually reflect employee experience among the avalanche of data available
- Scattered signals that are difficult to combine into one credible DEX score, leaving no baseline to track or prove improvement against
- DEX reports that describe the problem without providing the fixes.
The good news is that measuring DEX well is perfectly possible once you know which information to look at.
Read on to find out how to measure digital employee experience, including how to compose a DEX score and use it to drive positive performance changes across your organization.
- What is the digital employee experience score?
- Why DEX is hard to measure
- How to measure digital employee experience: The 3 data layers that matter
- How to build a composite DEX score
- How to turn measurement into action
- Turn DEX data into real business outcomes with Flexxible
Measuring DEX can be tough, but what if a platform did it for you and helped you act on it? Book a demo with us so we can turn employee experience insights into results.
What is the digital employee experience score?
A digital employee experience score (DEX score) is a composite metric that measures how well your workplace technology actually performs for the people using it.
The DEX score combines several metrics into one number, instead of tracking a single data point, and aims to show the day-to-day reality of working in your company’s digital environment.
These include:
- How devices and apps, from laptops to collaboration tools, perform
- Signs of digital friction, including the bottlenecks that interrupt workflows
- Employee sentiment about the tools they’re using.
The aim here is to look into whether employees can get their work done without friction, rather than simply checking that systems are working.
The need for this is clear: Gartner has predicted that through 2027, 80% of DEX tool deployments that focus solely on measuring activity within the IT department will fail to achieve a sustainable return on investment (ROI).
Measuring DEX across the organization is fast becoming a key business KPI, with the DEX score a central part of it.
Why DEX is hard to measure
In theory, measuring the digital employee experience sounds straightforward – a question of tracking how people interact with their technology and spotting where it lets them down – but actually doing it is much more complicated, both to capture the right signals and to make sense of what they mean.
Organizations may have mountains of IT data at their disposal, but the traditional sources only look at activity, rather than the experience behind it.
Here are a few reasons why DEX is so tough to measure.
1. IT support tickets
IT teams have long used the help desk as their main window into employee pain points, but tickets only show the issues people bother to report, and most employees would rather work around a problem than raise it.
“A ticket count tells you what broke loudly enough that someone bothered to report it,” says Hayat Amin, Founder of Beyond Elevation, an AI-native IP strategy firm. “It tells you nothing about the person who hit the same wall, shrugged, built a workaround, and quietly decided the tools here are not worth fighting.”
Either way, by the time the problem has surfaced, the disruption has already eaten into time and productivity, with most of the frustrated end-users staying invisible.
2. Siloed data
There are many revealing DEX signals, but these tend to sit in different areas of the business. IT teams hold endpoint health and device data, while HR teams sit on employee feedback.
This disconnect makes it hard to connect a spike in laptop crashes to a dip in employee satisfaction.
3. Remote work creates blind spots
Workforces spread across home offices, branches, and frontline locations are difficult to monitor. You might have an employee with a poor home connection have a completely different digital workplace experience than someone at headquarters, but some IT leaders never see it because they only monitor the office network, probably with traditional RMM tools.
4. Hard and soft signals don’t always agree
Organizations can have all the data in the world, but DEX is still hard to read because it’s a composite of hard and soft metrics. These two sets of data may tell opposite stories. IT might give an employee an excellent support experience, for example, but the worker might stay unhappy with how their tools work day-to-day.
It’s also difficult to find the root cause of a technical problem. A lagging web app might be a problem for the development team to fix, a flaw in the process flow, or a genuine technical fault for IT.
Performance data alone can’t tell you which of these it is. It’s only when you combine it with employee sentiment that you can pinpoint where the issue lies, and who needs to fix it.
Taken together, these challenges can mask the real employee experience, but with the right combination of hard and soft data, it is possible to get an accurate DEX picture, which organizations can package into an easy-to-read score.
How to measure digital employee experience: The 3 data layers that matter
If you’re a business leader interested in measuring DEX, then the good news is that you can do so using three strong data layers.
Each one of these covers one of the blind spots we mentioned in the previous section.
1. Technical performance data
Looking at objective, real-time telemetry from every endpoint in your estate makes a strong foundation for measuring DEX. It captures what's actually happening on each device, session, or app as it happens, rather than relying on what employees remember to report.
Key signals include:
- How healthy a device is, across both virtual and physical endpoints, including the CPU, RAM, and GPU utilization, disk performance, and battery condition
- How the network is performing, in terms of latency, connection drops, and VPN reliability
- How apps are behaving, such as crashes, freezes, load times, and errors across the app lifecycle, including the web apps employees rely on every day.
Modern DEX solutions track this telemetry continuously rather than in periodic checks, building a live picture of what's going wrong as it happens.
The best ones let support teams spot when UXI (user experience) is about to dip, and then fix problems before employees ever notice them.
2. Behavioral and usage analytics
Technical data lets you look under the hood of systems and how they work, while behavioral data will tell you whether they’re working for people, including which tools get used and where usage patterns reveal a problem working across a workforce.
This layer focuses on usage patterns across the workforce, including:
- Which apps they use heavily, underuse, or duplicate
- Whether a new rollout is working or not
- When something starts to go wrong at scale.
This layer shines a light on digital friction, those small interruptions that don’t make it onto a support ticket but instead compound into serious lost time and productivity across a large workforce.
3. Employee sentiment
DEX is all about human interaction, so employee sentiment is the most important digital employee experience metric.
User feedback (collected via Pulse surveys and bidirectional employee engagement channels) captures what the telemetry can't: how the experience feels.
The most effective DEX tools gather this sentiment directly inside the workspace, so feedback is tied to the moment and the task it relates to – an approach platforms like Flexxible’s FlexxClient build in as standard.
Sentiment fills the gap that technical metrics leave behind. A system may look “green,” but employees can still find it confusing or ill-suited for how they work. A gauge of employee sentiment keeps this honest.
The metrics that separate activity from experience
If we dig deeper into the three layers, we start to see some metrics, or KPIs, that provide insights into the real user experience, and others that simply show how busy IT is.
Here’s a breakdown of these two types of metrics, so you can tell them apart.
Activity Metrics vs Experience Metrics
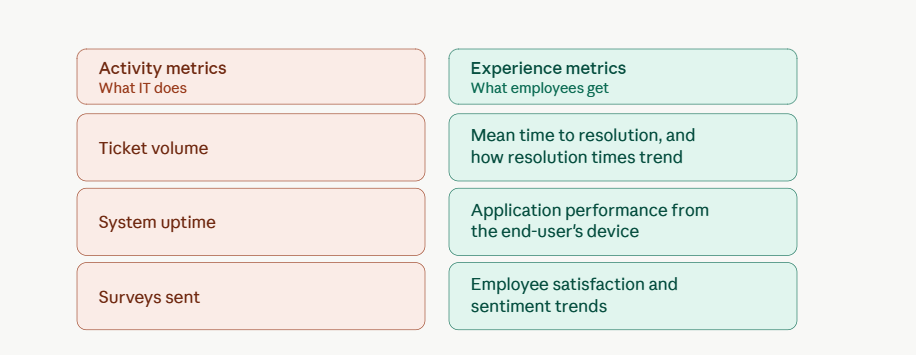
This isn’t to say that activity metrics are useless, but they don’t connect directly to important business factors, like employee productivity and engagement, which ultimately drive retention.
Employees who fight their technology every day are measurably more likely to disengage and leave, which makes strong DEX a real factor in business success, rather than just an initiative dreamed up by IT.
How to build a DEX score that drives improvement
Once we have a better idea of the metrics in each data layer, the next step is to condense them into a single, trackable experience score that’s easy to understand and act on.
Here’s an effective way of doing this.
1. Combine the layers without letting one mask another
Leaders might get tempted to put every signal into a single weighted number, but this hides important information.
Instead, the best approach is to keep layers distinct, then read them together. This way, you can see when hard performance data and soft sentiment agree, and you have a clear signal. You also get an insight when they conflict: spotless metrics with unhappy users indicate a workflow or process problem, rather than a technical one.
2. Set a baseline before you optimize
Many organizations fall into the trap of using the first employee experience measurement as a verdict, but it should instead be a reference point.
The best route is to capture at least a few weeks of data across all layers and measure it against this starting point before jumping to any conclusions.
3. Score by persona, not just by average
A typical organization has a broad cross-section of employees, so a company-wide number is not that useful.
Segmenting a workforce by role, location, or even type of device will be much more insightful. A frontline worker, for example, may love a tool that causes a daily bottleneck for someone else.
This score can be useful, but only leaders know what to do with it.
"A composite DEX score is only credible if it points to a decision,” says John Russo, VP of Technology Solutions, OSP Labs, a healthcare software and IT services firm. “If a score can't tell you which tool is slowing a specific team down, or which workflow employees are abandoning, it isn't measuring experience: it's measuring IT's comfort with data."
A score is only worth building if it changes what you do next, which means the moment your workforce spreads across locations, knowing who to act for (and where) gets harder.
Measuring DEX across a remote and frontline workforce
The flip side of dividing scores by personas is that they are spread across home and office locations, which can muddy measurement.
Two actions help deal with this:
- Monitor the whole estate, end-to-end. Experience data has to span the whole estate, including the endpoint, the network, the virtual platforms, and the web apps. If not, then blind spots anywhere can distort the picture.
- Bring it into one platform. A single console showing every digital touchpoint across the employee journey, from onboarding to daily work, turns scattered regional data into one unified picture that IT leaders can act on.
Carrying these out independently, however, can be a daunting task, which is why many organizations are turning to advanced DEX solutions.
How to turn DEX measurement into action with FlexxClient
Knowing how to measure digital employee experience is one thing, but acting on it brings a whole different challenge. The data that should drive fixes is usually scattered across separate tools for physical and virtual endpoints, so IT is acting on half the picture.
FlexxClient was designed to solve this. While RMM tools watch the device and virtual desktop platforms watch the sessions, the platform works across both environments to produce a unified view of experience across device and session.
“Most IT teams can tell you how healthy their infrastructure is, but not how it feels for the people using it,” says Adam Cooperman, Flexxible’s Director of Strategic Sales. “FlexxClient sits across both your physical and virtual estate, connecting the device, the session, and the person using them in one console, so you're finally measuring the experience, not just the health of the boxes”.
From there, FlexxClient closes the loop and brings process, people, and technology together so issues get resolved.
Self-healing automation fixes common problems across both physical and virtual environments before they reach the help desk, and AI-powered reporting turns raw data into compliant decisions leaders can act on.
The results are powerful: on average, users report:
- 78% of lost employee time recovered
- 65% of issues diagnosed faster
- 19% of tickets resolved automatically
The estate has changed. The question for 2026 is whether your setup shows you the health of the boxes or the experience of the people using them.
Stop guessing and start measuring. Book a demo today and see how FlexxClient turns DEX data into productivity, satisfaction, and measurable ROI for your organization.
Recommended for you
- Looking for a Nexthink Alternative? How to Find One That Works For Your Organization
- How to Make Wake on LAN Work For Your Business in 2026
- The Next Generation of RMM Is Here – and It's Called DEX. Here's How to Get Ready
- How to Optimize Productivity With These 5 Digital Workspace Essentials
- What is a Digital Workplace? How to Make it a Strategic Advantage in 2026
- How to Understand Gartner Digital Employee Experience in 2026: Which Platforms Are IT Leaders Backing?
- How to Turn Data Into Decisions With AI-Powered Reporting Tools
- What Digital Employee Experience Looks Like in 2026 (And How to Get It Right)

