
Does your organisation have more data than ever, but fewer clear answers to help you make decisions?
If so, you’re experiencing the growing tension behind modern data analysis. For many IT leaders, the modern deluge of data has made it difficult to turn fragmented information into clear answers that support decision-making, especially in key areas like digital employee experience (DEX).
Most leaders feel this pressure from three places:
- Too much data, trapped in dashboards. Critical information lives across logs, reports, and tools, but answering a specific question still takes hours or another ticket.
- Slow answers in distributed environments. In remote and hybrid teams, DEX issues can emerge quickly, but by the time reports are built or refreshed, the situation on the ground has already changed.
- Pressure to decide without clarity. Leadership expects fast, confident decisions, even when data is fragmented, hard to query, or locked behind technical workflows.
This guide helps bridge that gap between data and decisions. Read on to find out how artificial intelligence is reshaping data analysis in 2026, and how Flexxible turns complex data into instant answers IT leaders can use to move the business forward.
We’ll cover:
- What is data analysis in 2026?
- What is the purpose of data analysis right now?
- What does AI-powered data analysis look like in 2026?
- Turn data into instant answers with Flexxible’s new AI report tool.
The AI era offers incredible opportunities for IT leaders. Schedule a demo to find out how you can turn data into instant reports.
What is data analysis in 2026?
Data analysis is the process of turning raw information into something that helps businesses understand what’s happening (and why) and decide what to do next.
In practice, this involves working with structured data pulled from databases, applications, and digital systems, then applying techniques to dig out patterns and trends, including:
- Descriptive analysis – Summarises what has already happened using historical data
- Exploratory analysis – Identifies patterns, anomalies, and relationships worth investigating further
- Statistical analysis – Applies statistical techniques to validate trends and measure significance.
Tools like Excel, Tableau, and business intelligence platforms help visualise results, while data analysts and data scientists interpret them.
The age of AI is set to make data analysis even more crucial, with opportunities for organisations to turn vast reams of information into faster, more confident decisions.
“Data is the backbone of growth and optimization”, says Marco Costa, CEO at Exclaimer, Forbes Technology Council. “Research has shown that 49% of senior executives believe that analytics are a ‘key factor in better decision-making’”.
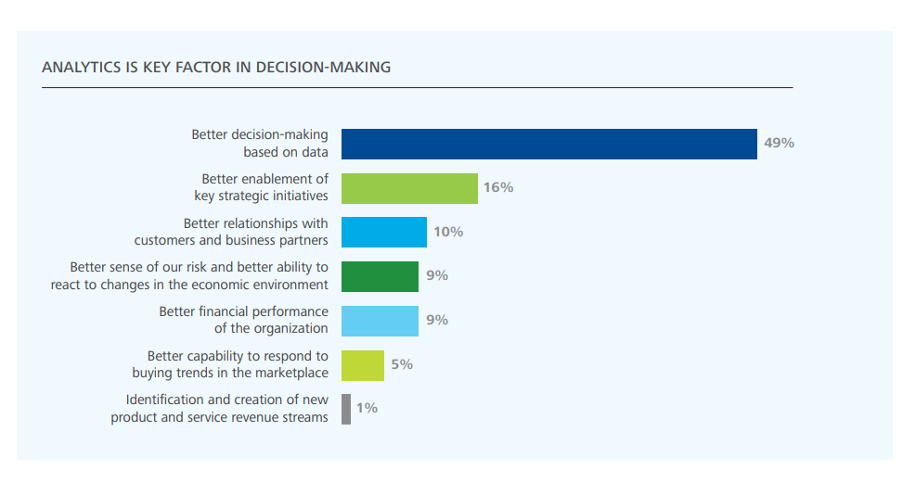
Indeed, the challenge isn’t access to data, but translating it into outcomes leaders can act on. Deloitte’s research below shows where organisations see the real value of data analysis today.
The Benefits of Data Analysis According to IT Leaders
What is the purpose of data analysis?
The purpose of data analysis is to support better decision-making – not just to explain the past, but to guide what happens next.
While analytical techniques (mentioned above) describe how data is examined, the purpose of analysis is defined by the questions leaders need answered. In practice, organisations apply analysis in different ways depending on the decision at hand.
- Diagnostic analysis focuses on understanding why something happened.
- Predictive analysis looks ahead, using historical data to anticipate future outcomes.
- Prescriptive analysis goes further by recommending actions based on likely scenarios.
Together, these approaches translate raw analysis into intelligence IT leaders can actually use to predict future outcomes or identify risks early. This matters most in complex, fast-moving environments, such as real-time operations, hybrid workforces, or areas like the supply chain, where decisions can’t wait for retrospective reports.
Here’s where a real shift is happening: larger data sets and more real-time inputs mean the onus is on organisations to move beyond static reporting and use modern data analysis tools that help them act on insights as they emerge.
What does AI-powered data analysis look like in 2026?
In 2026, AI-powered data analysis has opened up new doors for IT leaders, ones that lead us to real-time answers rather than delayed reports.
Instead of waiting on static dashboards, teams increasingly rely on AI reports that respond dynamically to the questions they actually need answered in the moment.
According to Gartner, AI-driven agents are expected to autonomously resolve 80% of common service issues by 2029 and reduce operational costs by 30%. That same shift is reshaping how organisations analyse and use their data.
From dashboards to questions that lead somewhere
Traditional data analytics still rely on predefined dashboards and reports, but AI changes the flow. Teams can ask direct questions in natural language and receive contextual answers drawn from historical data, real-time signals, and large data sets.
Crucially, those answers can be refined, tested, and adjusted as new questions emerge, without rebuilding reports from scratch.
Analysis that recognises repeat problems
AI-powered systems learn from recurrence: they highlight issues that happen again and again across devices or environments via pattern detection and data exploration.
This makes it easier to spot where manual effort is being wasted and where automation would have the biggest impact.
When insight turns into prevention
Machine learning now automates much of the data analysis process, from correlation to prioritisation. The next step is using those insights to define action, which includes testing responses, improving them through iteration, and eventually applying them automatically.
In this model, alerts move from being simply signals to react to towards starting points for prevention.
In short, AI-powered data analysis in 2026 is context-aware and built to stop the same problems from returning.
Turn data into instant answers with Flexxible’s new AI report tool
The real value of AI-powered data analysis shows up when insight turns into action, yet many organisations struggle to bridge that gap. Those that can will have a key competitive advantage over rivals.
Flexxible’s new reporting feature, Create with AI - Reports, is designed to shorten that distance. Get custom reports from your device fleet in seconds, using natural language instead of SQL queries and scripting.
From manual fixes to decision-ready answers
Every IT leader knows the frustration of having plenty of data but still struggling to answer a simple question.
Disk space issues are a familiar example: alerts trigger, tickets follow, fixes are applied manually, and a few weeks later, the same problem resurfaces. The data exists, but turning it into informed decisions takes too long.
Flexxible’s new AI-powered reporting capability changes that dynamic. When a critical alert appears (for example, insufficient disk space across multiple devices), IT teams no longer need to dig through dashboards, data warehouses, or predefined reports
Instead, they can ask a direct question in natural language and receive a clear, contextual answer drawn from large volumes of data, both real-time and historical..
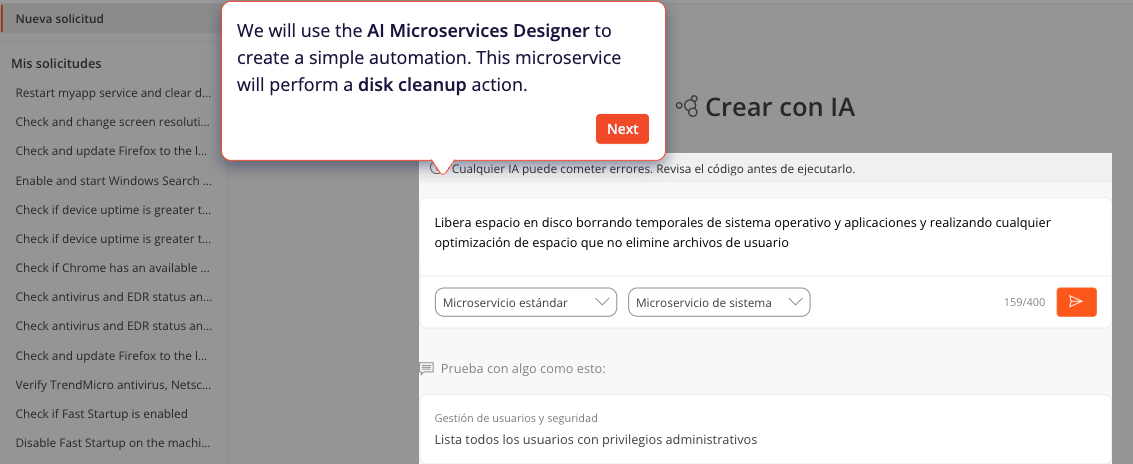
Ask A Natural Language Question to Flexxible’s AI Feature
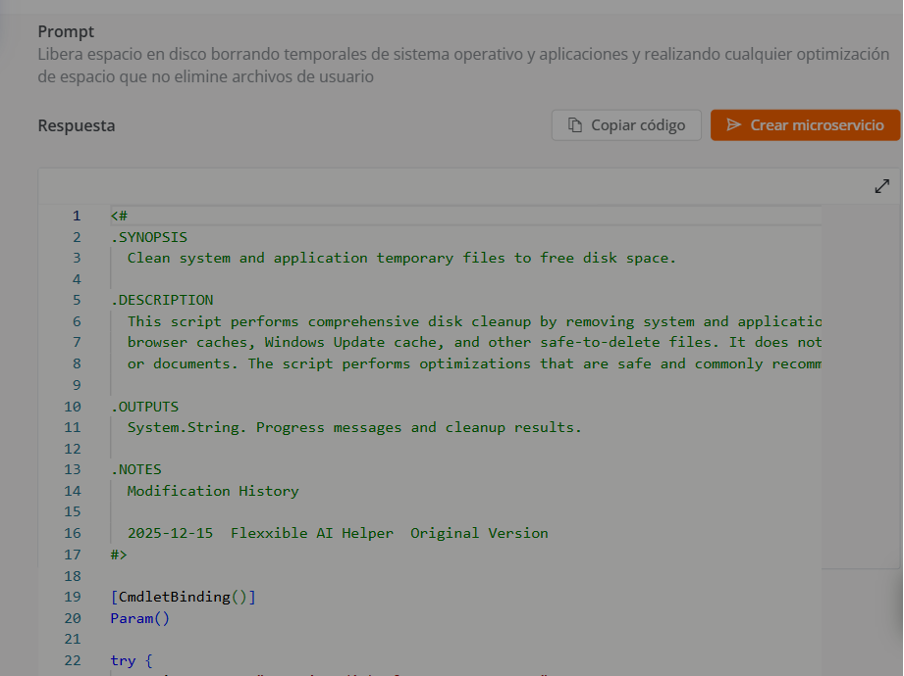
Get an Real-Time Answer To Copy a Cleanup Script or Create a Microservice
“Organisations don’t lack information about their infrastructure,” says Kilian Arjona, CTO at Flexxible. “The real challenge is turning those massive volumes of data into concrete answers when an IT leader needs them.“Create with AI – Reports changes that paradigm. It removes the barrier between having a question and getting an answer, without relying on someone having preconfigured it in advance.”
From questions to insight, without friction
Using AI-driven reporting, IT teams can query their environment without SQL, Python, or specialist programming languages.
Questions like “Which devices are repeatedly running low on disk space?” or “Where are cleanup actions failing?” get translated instantly into structured results, thanks to a combination of data mining, data cleaning, and data visualisation behind the scenes.
Crucially, those answers aren’t static. You can refine or expand them as new questions emerge. This turns analysis into an active part of the data analysis process, not a one-off report.
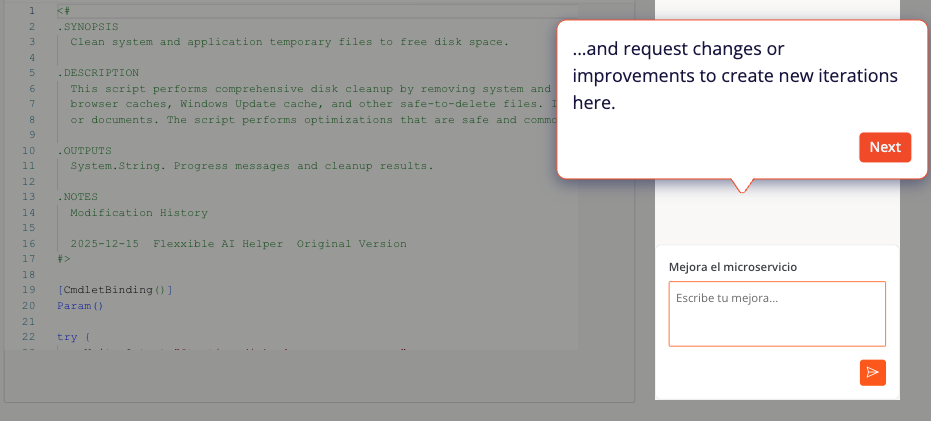
Easily Change or Improve Your Microservices As You Go
When insight turns into prevention
Once patterns are clear, Flexxible connects insight directly to action. Using AI-generated microservices and AI automation scripts, your team can create and refine automated responses (such as disk cleanup) and link them to conditions that trigger automatically. Over time, repeated issues move from reactive fixes to proactive prevention.
The result? Simpler decision-making at scale, which means fewer recurring problems and less manual work. You also get the peace of mind that your organisation’s data isn’t just being analysed, but turned into valuable information you can act on.
Want to find out how AI data analysis tools can help your organisation grow? Schedule a demo and see just how easy it is to get the valuable insights you need.
Recommended for you
- Create with AI - Reports: Why Flexxible Decided to Change How We Interact with Data
- From Hours to Seconds: AI-Powered Reporting Transforms IT Data Analysis
- Struggling To Get DEX Insights? How to Maximise Productivity With 10 Metrics
- What Digital Employee Experience Looks Like in 2026 (And How to Get It Right)
- Securing the New Office: Endpoint Management for a Hybrid Workforce
- Unlock Hidden Microsoft 365 Savings: The Report IT Leaders Need
- The End of Windows 10 is Near: Are Your Endpoints Ready?

